

How Deep Is Your Love?


The bear market is deepening. Investors are watching the market value of their portfolios decreasing week after week, and may be discovering just how deep their attachment is to their favourite stocks.
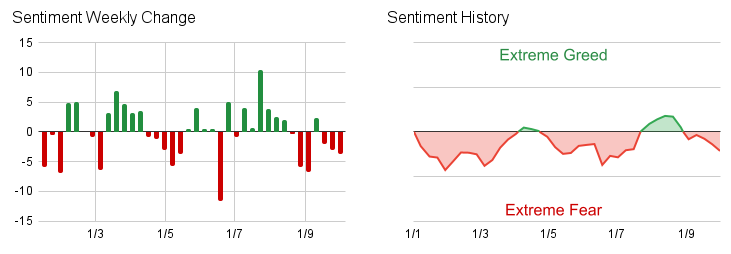
Sentiment towards the stocks in the MIA investment universe has been negative for 30 of the 39 weeks up to the end of Q3 2022. For much of the year the MIA Sentiment Index has resided in the ‘Fear’ range mirroring a persistent but steady market decline.
Notably though, the index has so far not dropped into the ‘Extreme Fear’ range that would signal market capitulation. Sentiment fell for six of the last seven weeks of Q3 and the index ended the quarter once again in the ‘Fear’ range at 39.

The charts below show how the Sentiment Index has varied in the year to date:
Sentiment Indicators
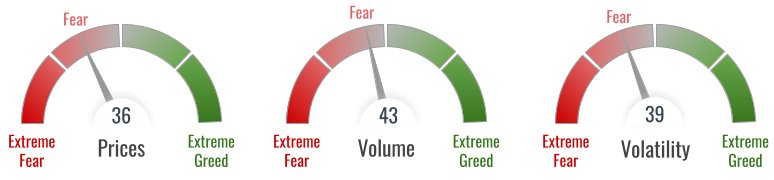
The MIA Sentiment Index is driven by 3 underlying indicators:
Price Indicator: This indicator combines price strength, relative to 52 week highs and lows, and price momentum relative to the 130 day moving average.
Volume Indicator: This indicator measures the extent to which price movements are backed by the volume of trades.
Volatility Indicator: This indicator measures downside volatility relative to its 50 day moving average.
All three sentiment indicators ended Q3 in the ‘Fear’ range with the Prices indicator showing the most weakness. The higher value displayed by the Volume indicator reflects that while markets have been in constant decline since the start of the year, sellers have not (yet) outweighed buyers in the numbers required for market capitulation.
Prices
About two thirds of the stocks in the MIA investment universe are currently trading above their 130 day moving average. After months of decline, those averages are now at a much lower level than they were with 65% of MIA stocks either at or very close to 52 week lows.

Trading Activity
Approximately 60% of MIA stocks experienced net selling activity in the last 130 days, illustrated in the chart on the left below which shows the relative strength of trading activity in MIA stocks.
The chart on the right below indicates that downside volatility is above the 50 day moving average for approximately 60% of MIA stocks.

Heading Towards Capitulation?
Q3 began promisingly with sentiment improving for 6 consecutive weeks as stocks rallied, pushing prices above their short term moving averages. But this was a bear market rally, and the MIA Sentiment Index barely got into positive territory before prices went into reverse. As we enter Q4, sentiment is again trending downwards, and macro factors continue to drag share prices lower.
The market decline has been steep, but orderly. For investors there are no easy answers, but for those that remain invested the reality of increasingly large drawdowns will test their resilience. Markets always turn eventually, but not usually before the steady stream of investors heading for the exit becomes a stampede.
This article is intended for informational purposes only. It is not a recommendation to buy or sell shares or other investments. Always do your own research before buying or selling any investment or seek professional financial advice.